No clock, no counter
When Travel Costs Less
You will find no clock ticking down here, no tally of remaining places and no figure with a line through it. It has the four structural reasons travel costs less, which of them apply now, and one honest note about where a low figure carries a risk.
What is not on this page, and why
- A countdown clock
- none. Refresh the page on a site that runs one and the clock restarts from the top. That is the whole measure of what it was telling you
- A seat counter, or any count of places left
- none. No live feed of anybody's inventory reaches this desk, and printing a figure without one would be invention
- A price with a line through it
- none. For a struck out figure to be truthful somebody has to have actually sold at it, routinely, over a real stretch of time. This desk keeps no such records, so it prints no such figures
- A notice that somebody just booked
- none, ever
- A code
- none. A code implies this office sets the price. It does not; it decides which companies get asked and whether the figure has everything in it
The four reasons a trip genuinely costs less
| The reason | What it really is | How much it moves the figure |
|---|---|---|
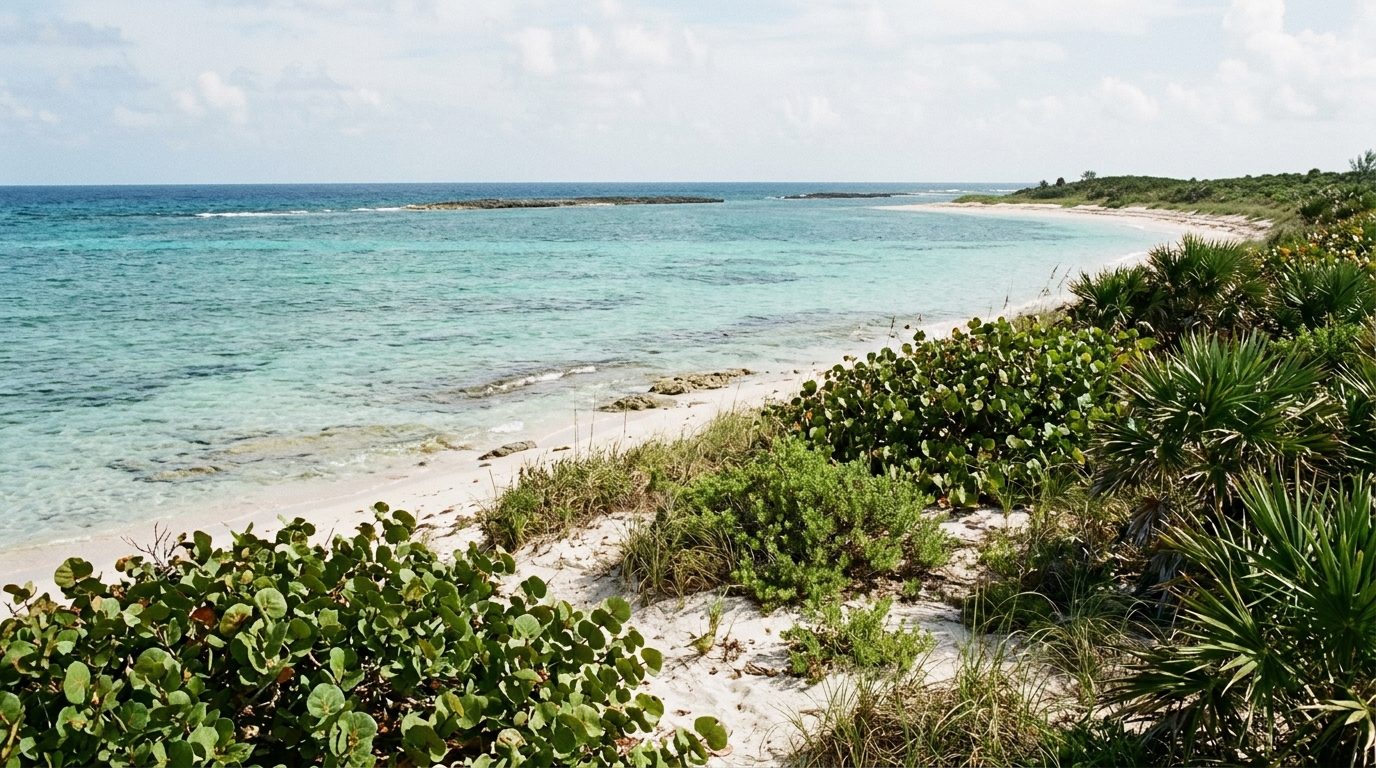
| The weather is wrong for the season | Hurricane season in the Caribbean, high summer inland in southern Europe, the wet side of the tropics | The largest single lever. Often a third, sometimes more |
| The weather is right and the schools are in | September's opening fortnight, the bulk of May, the back end of January | The best value in travel. Same weather, fewer people, lower rates |
| A company needs to fill something | A departure an operator cannot fill, cabins still empty as a sailing approaches | Real when it happens and impossible to schedule. It is also the one reason that gets better with fewer companies, because one company can discount its own product and four cannot coordinate |
| You can move a day | A Tuesday out rather than a Friday, the routing with a change rather than the quick one, a sailing that leaves on the day fewer people want | Small alone, and it compounds across a party of four |
Roughly, by month
| Months | What falls | What you give up |
|---|---|---|
| January and February | Almost everything except Alaska, which is closed | Short days, and things closed at the far end |
| March to early June | Southern Europe is excellent value, Iceland opens | Rain in March, and Easter week is the worst value in the year |
| Late June to August | Nothing falls anywhere we book | The highest rates of the year, full ferries and heat inland |
| September | rates across Europe fall once the first week is out, and the islands peak | that opening week still carries August rates |
| October and November | The best value of the year across most of the list | Days shorten quickly and opening hours shrink |
| December | Almost everything rises from mid month | The holiday fortnight is the second worst value in the year |
Where the low figure carries a risk, said plainly
Late in the hurricane season is where the smallest numbers on this sheet live. That risk is genuine and the companies have priced it in; a week you cannot shift turns the saving into a wager placed with your one holiday. Travel at short notice with your eyes open and it is, honestly, the least this desk ever arranges a week for.
On a four company trip that calculation changes entirely. One disrupted flight there takes three other contracts with it, and the saving is nowhere near the exposure. We will say so rather than quote it quietly.
Deadlines
Nothing here carries one set by us. When a company has pinned a rate to a date, the proposal states which date and which company pinned it.